The Telegraph built a tool that auto-creates graphics of Premier League goals

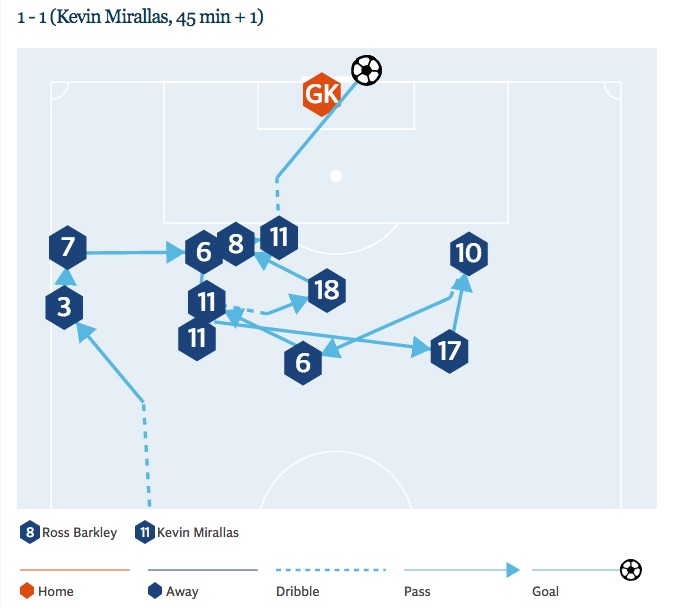
The Telegraph has made changes to its sports data-visualization tool so interactive graphics are created and published on site automatically each time a football goal is scored.
“We were trying to solve two problems: how to produce sports visualizations in real-time, and how to automate and save time,” said Malcolm Coles, director of digital media at Telegraph Media Group. “For this we needed to set up a rules engine to analyze data without the journalist even realizing that the story had happened.”
The Telegraph’s graphics tool was created for the Rugby World Cup last year to generate interactive graphics of the game play. Earlier this year the Telegraph received €300,000 ($345,000) in funding from Google’s News Initiative to develop it further, and it switched to make graphics of how goals happened. Since mid-August, in time for the Premier League, these graphics can be created and published automatically each time a goal is scored.
Previously journalists would have to wait until after the game to get specific charts produced by the graphics desk. Now the interactive graphics are inserted into the live feed on the Telegraph one minute after the goal has been logged. During the weekend of August 20-21, 22 goals were auto published over ten games. In time, these will automatically be posted to the Telegraph Football Twitter account (where a tweet of a graphic gained 790 retweets compared to the more normal 80 retweets) and Facebook Messenger.

The data is taken from Opta, the sports data provider, which measures who touches the ball from where on the pitch. The plan over the next two months is to create six more rules that will automatically generate and publish a graphic based on the game play, besides scoring goals. During this time frame the Telegraph team, two full-time developers and several contractors from Google, is building text templates so that these graphics will also trigger automated accompanying text to tell the story.
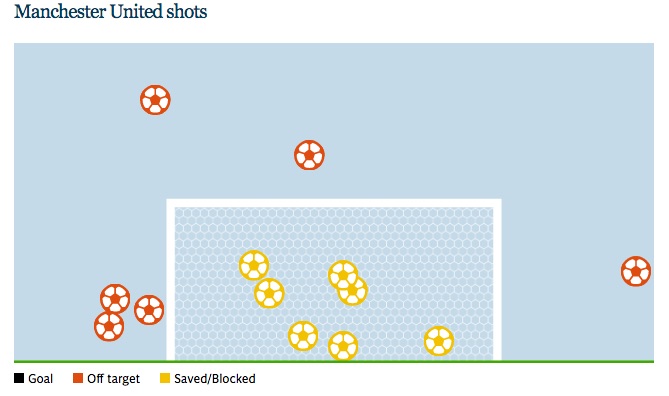
One possible rule the Telegraph is contemplating is that if one team has more than 70 percent possession of the ball and has made five shots at the goal but scored none, it would trigger a graphic of the goal attempts and whether they were off target or well-saved. The automated paragraph would read that team A is on top possession-wise, but they aren’t being very effective with it.

But Coles is weary of too many graphics, currently its looking to do up to 10 per match. The aim is to cover each of the matches played during the weekend, approximately ten a day, with the smaller games automated.
For now the focus is the live sports blogging, these are some of the Telegraph’s most read pieces, with important matches fetching 100,000 pageviews. But it won’t be limited to football coverage.
For some time now Associated Press has been experimenting with automated financial reports. More recently the Washington Post built Heliograf, a tool that wrote the outcomes of Olympic fixtures in its live reporting. The Telegraph’s sports desk will be working closely with the developers to make sure the automated text doesn’t sound robotic, according to Coles.
“For big games you’ll always want a journalist to give the real flavor of what’s happening, give longer-term perspectives, and describe the atmosphere and the pressure on the managers,” Coles said. “That sort of stuff isn’t in the data.”
Images courtesy of the Telegraph.
More in Media

Digiday+ Research: Dow Jones, Business Insider and other publishers on AI-driven search
This report explores how publishers are navigating search as AI reshapes how people access information and how publishers monetize content.

In Graphic Detail: AI licensing deals, protection measures aren’t slowing web scraping
AI bots are increasingly mining publisher content, with new data showing publishers are losing the traffic battle even as demand grows.

In Graphic Detail: The scale of the challenge facing publishers, politicians eager to damage Google’s adland dominance
Last year was a blowout ad revenue year for Google, despite challenges from several quarters.


