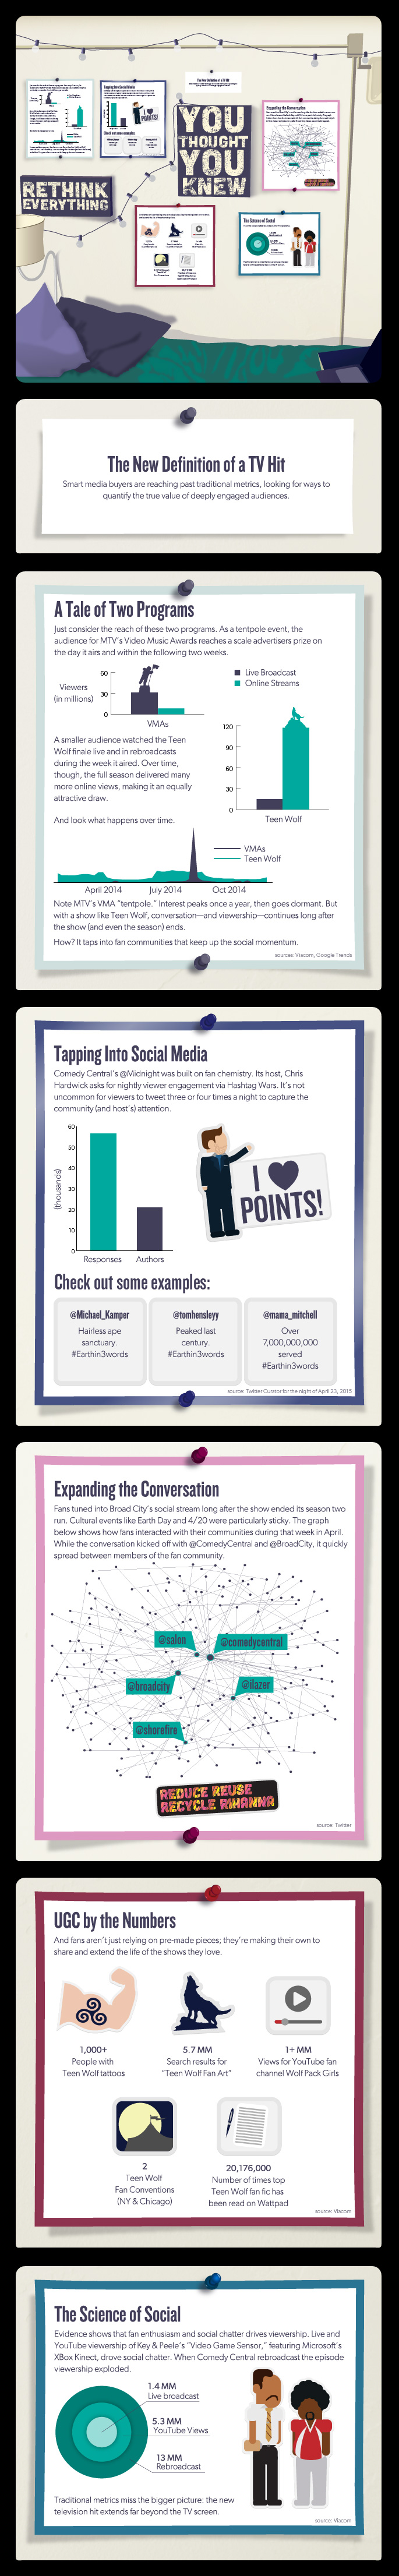
Infographic: How social drives TV viewership and other metrics that matter
If you missed C-SPAN’s live broadcast of President Obama’s Correspondents Dinner speech last month, you’d be forgiven. But by now, you’ve likely heard about it in the mainstream press, via some social network or other and, probably, watched it on YouTube. After all, the co-presenter was none other than Luther the Anger Translator as played by Keegan Michael Key.
So far, the C-SPAN video alone has racked up more than 5 million views on YouTube. By contrast last year’s speech–delivered by the President alone–got about 2 million all year. What does this prove? That TV doesn’t just move metrics, it moves culture.
To better define just how big an impact television makes, we dug into a few stats to show how great TV lives on beyond the set top box in multi-platform viewing, fan communities and more.


More from Digiday

How a fitness creator built her own global wellness platform
Gabby George leveraged her social media success into a subscription-based fitness platform to diversify revenue.
Future of Marketing Briefing: Media measurement is becoming an asset in boardroom theater
Major advertisers spent their quarterly earnings calls talking up media effectiveness efforts to analysts and shareholders this week. It suggests a shift in the way C-suites consider ad spend.

Nike, Lululemon hit with lawsuits alleging deceptive ‘phantom discounts’
In recent weeks, major global brands have been the subject of lawsuits alleging deceptive pricing strategies.