Join us on July 30 in NYC for a breakfast & panel
Publisher ad revenue on the rebound as of Q2, up from Q1’s rock bottom, per two industry reports

The advertising decline has bottomed out and is on a gradual incline, at least according to two recent industry benchmark reports.
Boostr’s 2023 Media Ad Sales Trend Report and Operative’s H1 2023 Benchmarking Report both indicate the tides are turning for the better when it comes to publishers’ digital advertising revenue. While quarter one was lackluster in more ways than one, the second quarter started revving up as several ad categories unfroze budgets and began transacting with digital publishers, ultimately ending the quarter up 3% year over year, according to Boostr data.
But even though ad revenue is finally tracking up, other measurements like deal volume, deal cycle length and average deal dollar amount are still lagging behind in the year-over-year or even quarter-over-quarter comparisons.
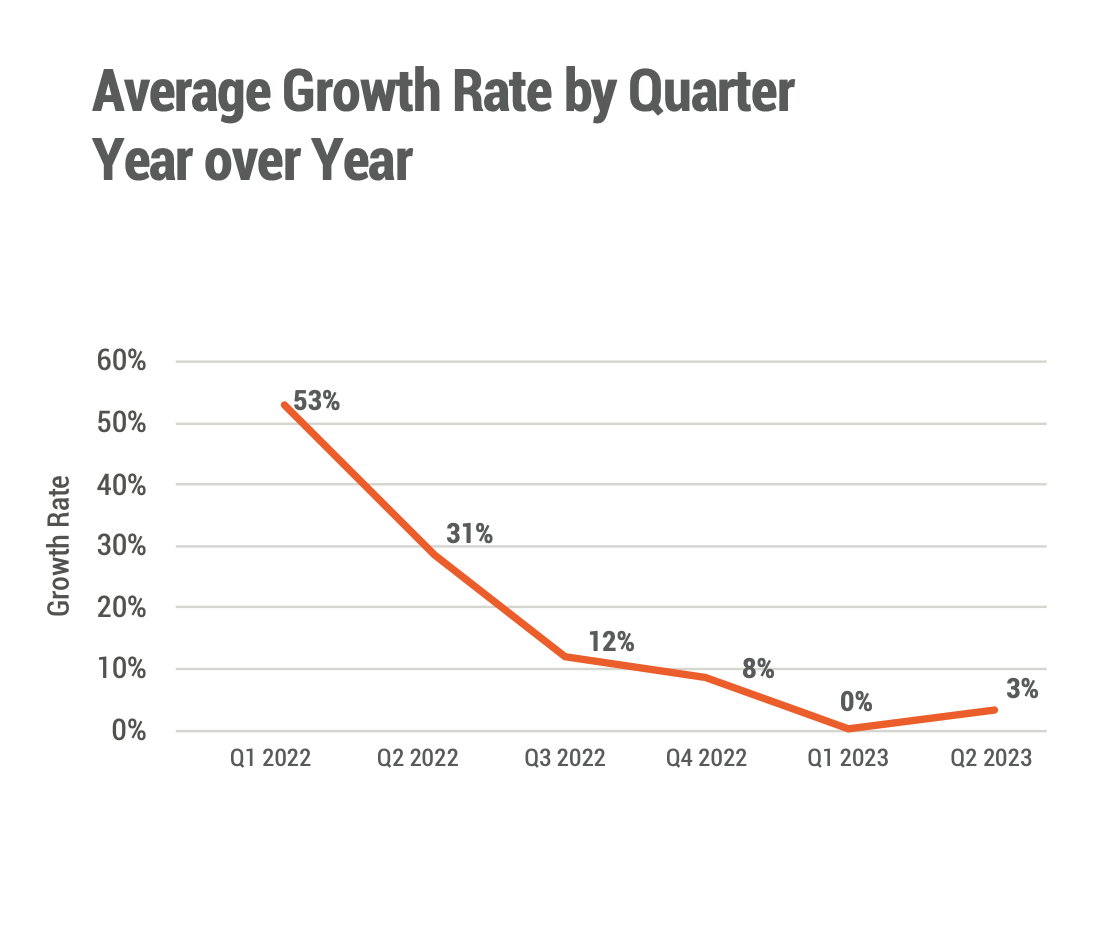
“We’ve been progressing towards I mean [and]I think we’re there,” said O’Leary, who added that growth rates bottomed out to zero in the first quarter, but started a gradual incline to 3% in Q2. “[Magna’s] forecast for growth this year is around 4%, I think that it’s probably going to end up around [that]. Next year, there’s a lot of cause for optimism between the Olympics and politics.”
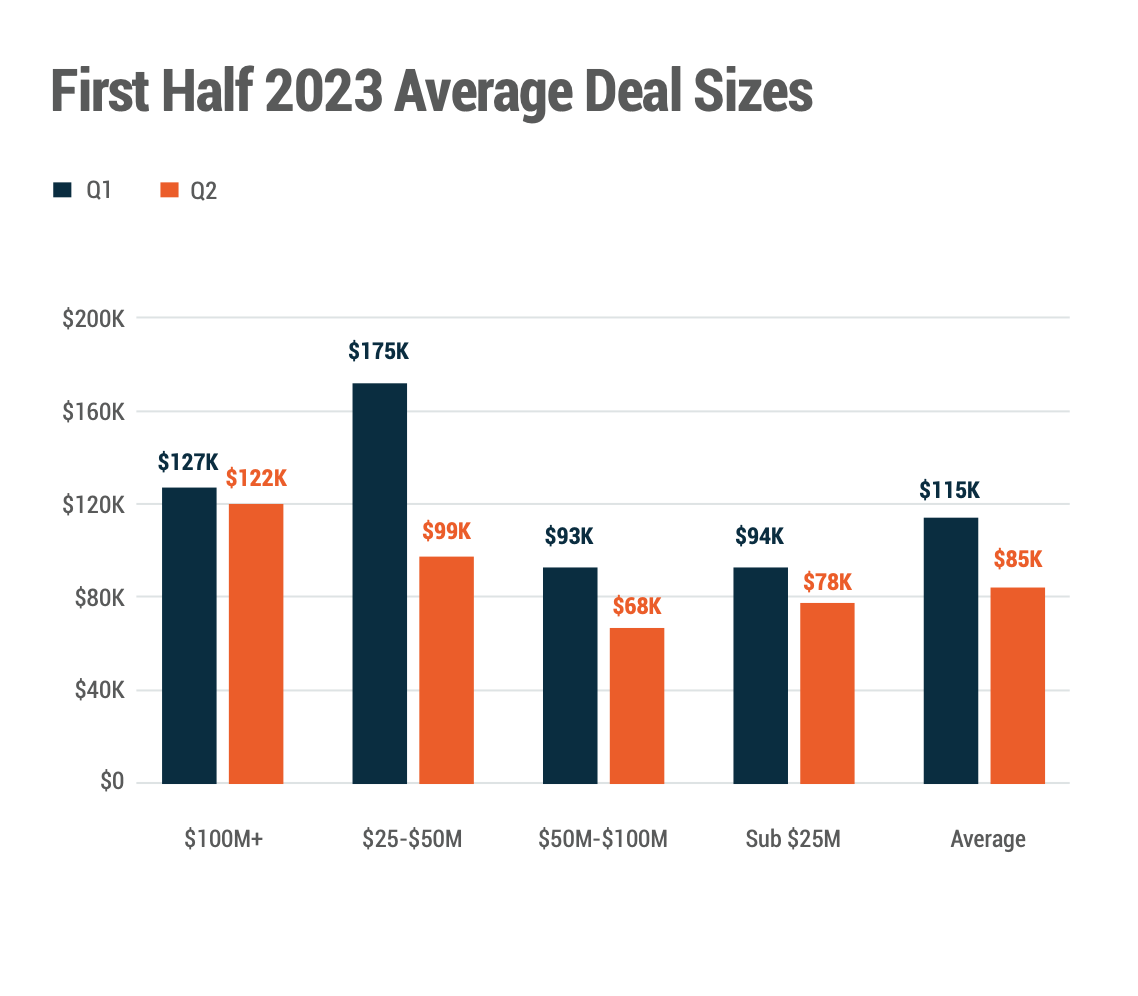
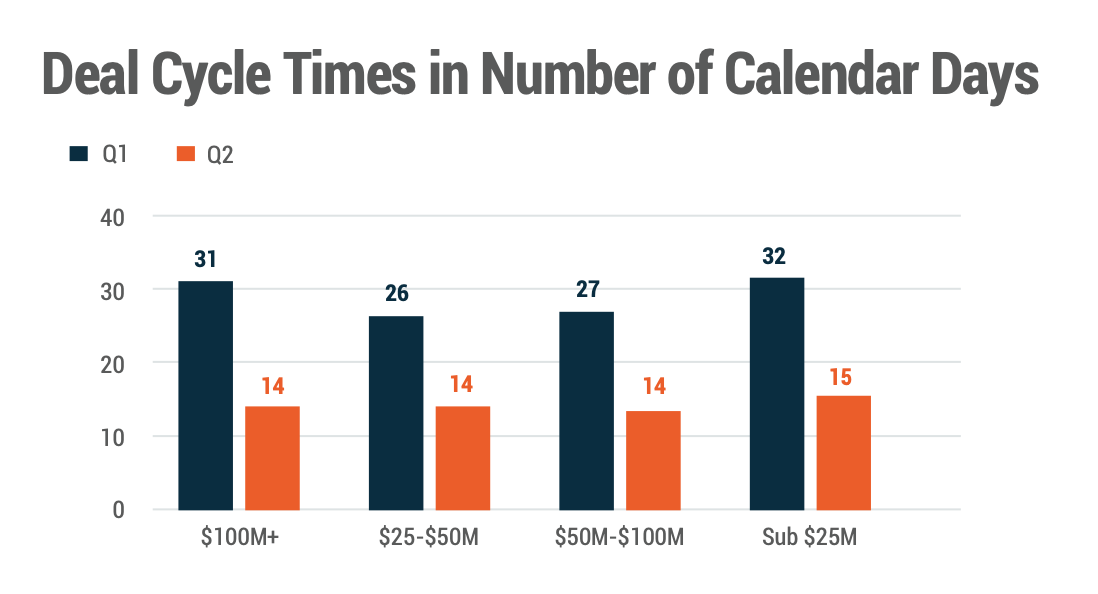
Despite there being positive momentum from the first quarter into the second, both the average deal size and the average length of a deal cycle decreased quarter over quarter, according to Boostr’s benchmark report. While the average campaign deal size among all publishers was $115,000 and spanned 31 days, in Q2, those figures fell 26% and 54%, respectively to an average of $85,000 and 14.25 days.
“The deal cycle times dropped pretty significantly so buyers seemed [to be] coming in with smaller budgets, and they were coming in very quickly, right before the campaigns were supposed to go live. So they’re making incremental buys,” said O’Leary.
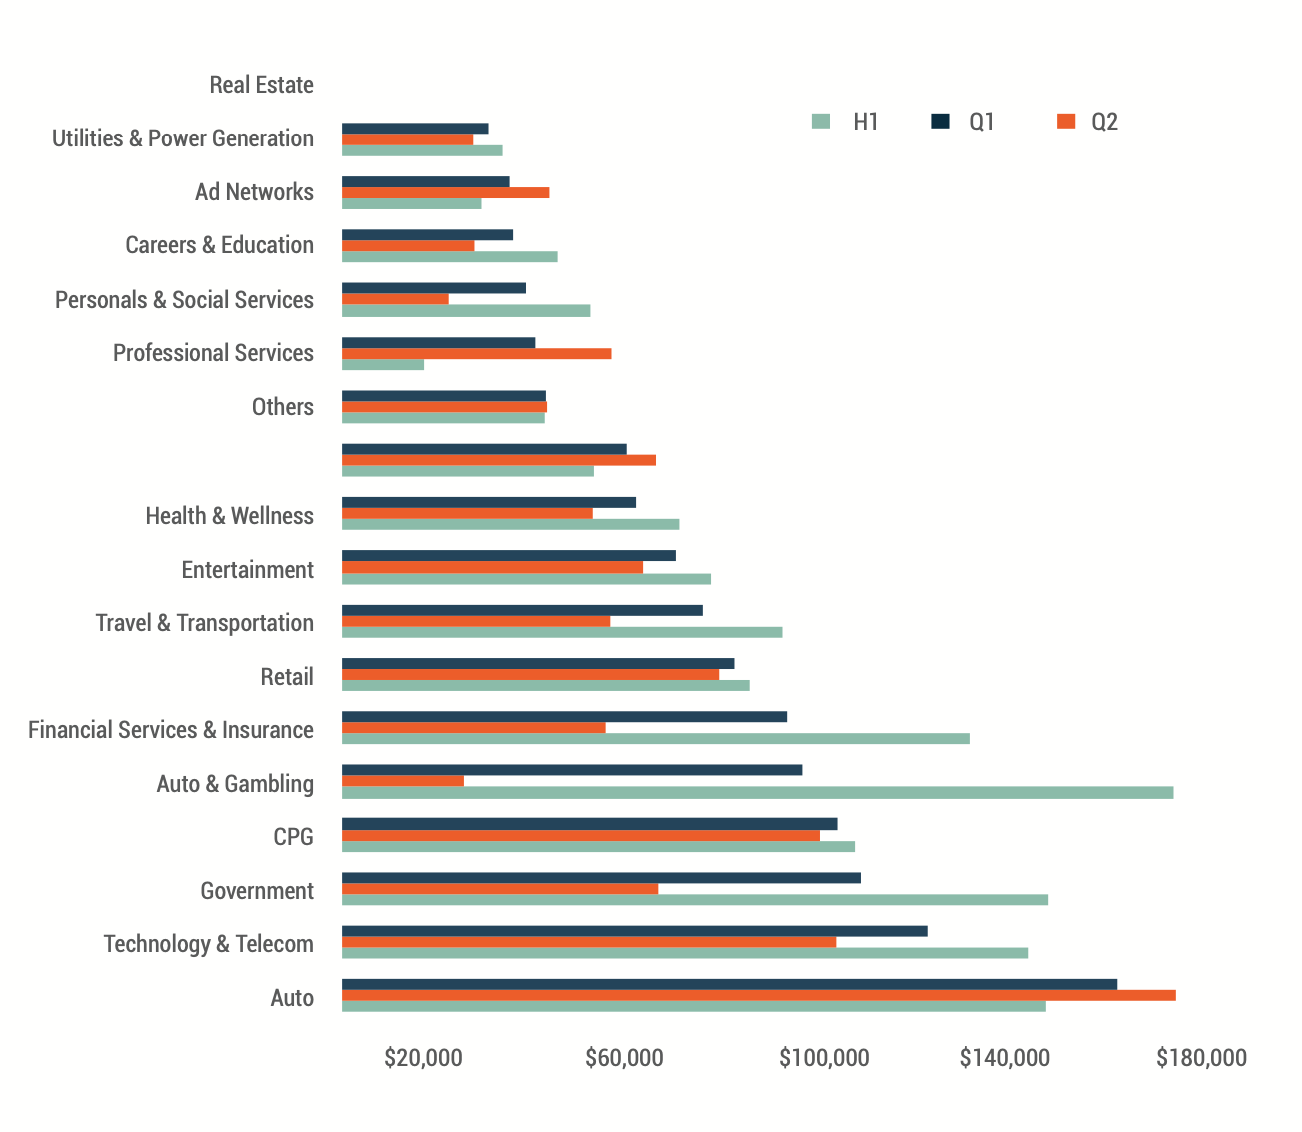
O’Leary couldn’t give a solid explanation as to why both these categories decreased from the first to the second quarter, given Q1 is typically the softer quarter for publishers when it comes to ad revenue. But two possibilities could be that ad categories like CPG, finance, tax and insurance were all down in spend year over year, and there was a slight favoring of programmatic campaigns over larger scale custom campaigns.
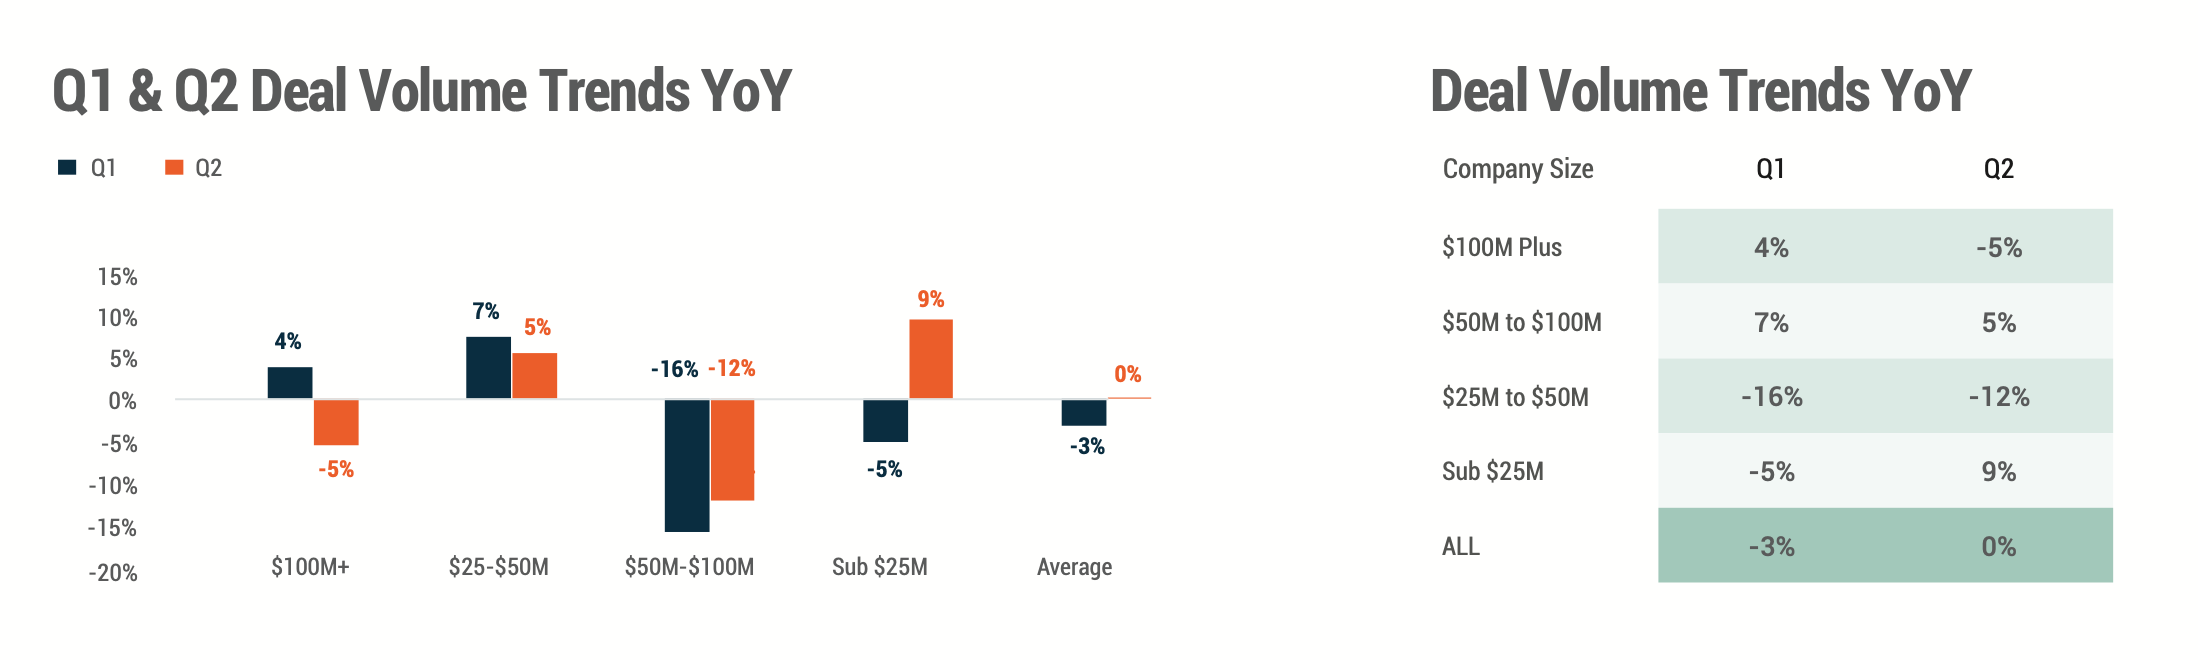
Average deal volume decreased by 3% year over year in Q1 and stayed flat year over year in Q2. Generally speaking, the second quarter saw an increase in campaign volume, with a couple notable exceptions based on company size. While small- to mid-sized companies (those that made sub-$25 million and between $25 million to $50 million annually) saw an improvement in deal volume from quarter to quarter, mid- to large-sized companies ($50 million to $100 million and $100 million-plus) experienced a decrease in year-over-year volume from Q1 to Q2.
Net revenue retention, or the amount of revenue that is retained from a cohort of advertisers, was down about 10% year over year in the first quarter, reaching 43%. This figure was a little better in Q2 at 47% on average. With several ad categories being down year over year, replacing any lost clients with new advertisers was more difficult, O’Leary said.
Programmatic progress
Digging into programmatic advertising with Operative’s H1 2023 Benchmarking Report, similar trends can be seen in the year-over-year first quarter softening followed by a slight rebound starting in the second quarter.

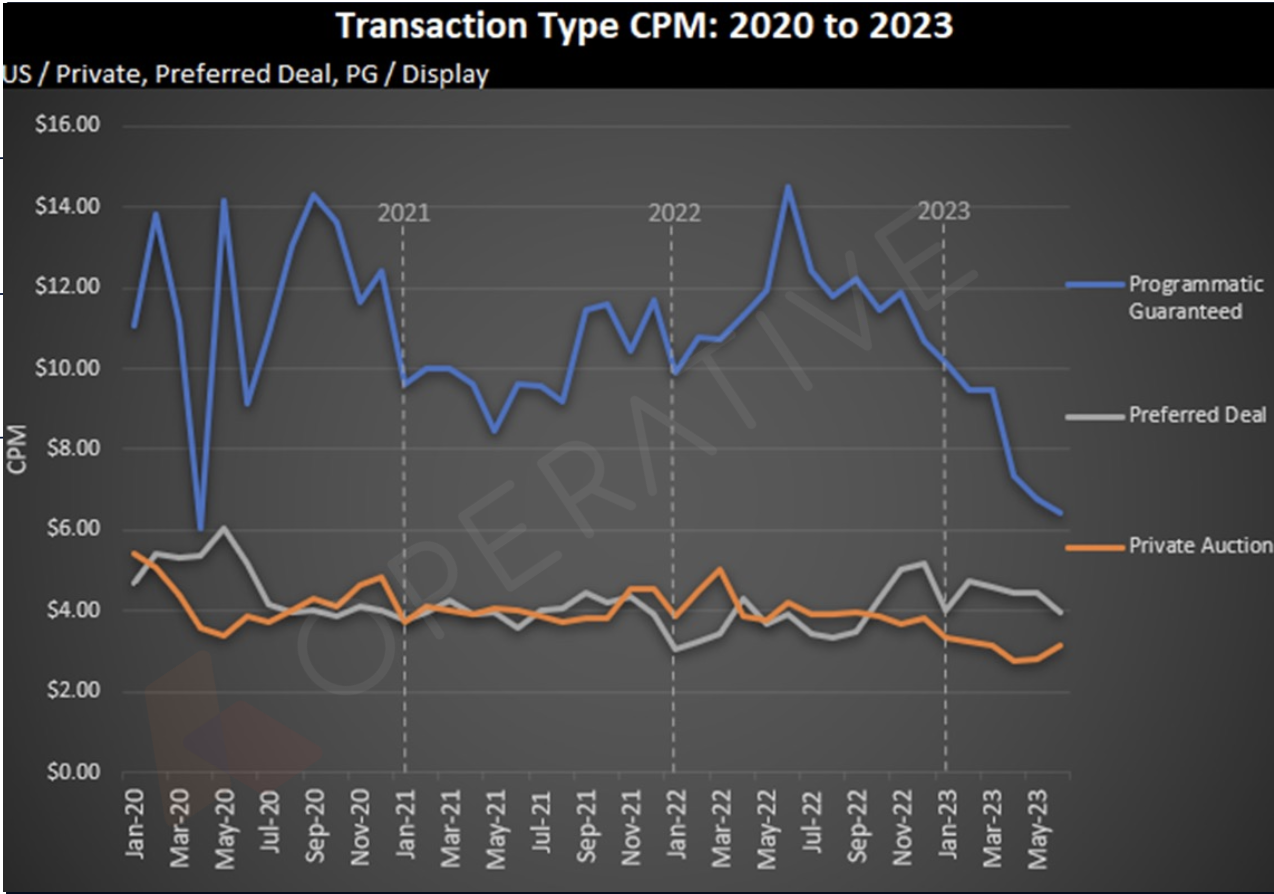
The 14% decrease in open programmatic CPMs year over year is not as worrisome to Ben Tatta, chief commercial officer at Operative, given the comparisons from first half 2022, which were still inflated in the post-pandemic false spring. Tatta added that one thing of note in the report is that CTV and video were far less impacted than display programmatic, down 9% and 13%, respectively in the open market.
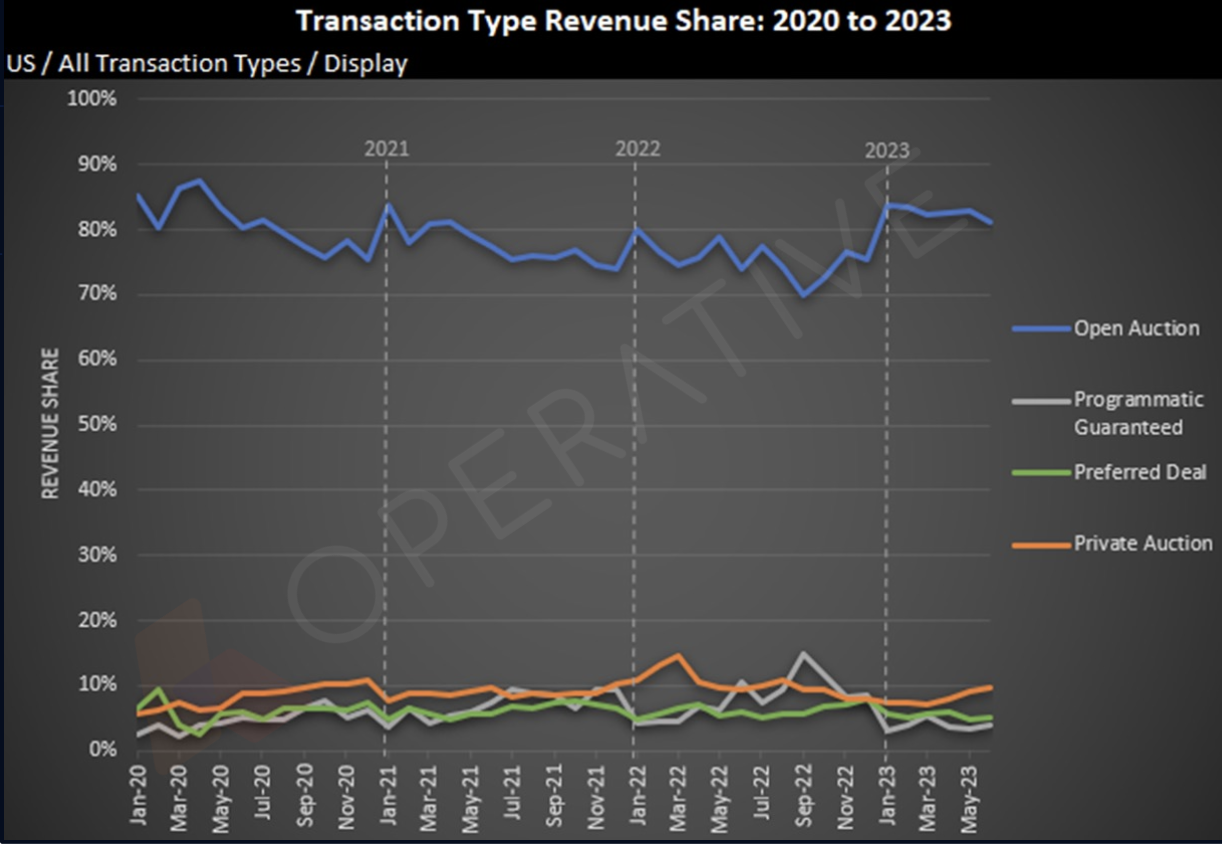
By and large, the bulk of ad dollars allocated for programmatic is going to the open market, returning to a “norm” of about 80% after dipping down to 70% in the second half of 2022, per Tatta.
“The decline was more significant in the early part of H1 vs. what we were seeing in June. So without a doubt that trajectory is going up. I guess the real question is if they’re going to strengthen back to pre-COVID levels, said Tatta, adding ‘I think they’ll come close.”


More in Media

WTF is LLM honeypotting?
Publishers and ecommerce brands under siege from AI crawlers are starting to fight back with an old security trick updated for the LLM era: “LLM honeypotting.”

Why a once-anonymous creator unmasked herself to build a bigger media brand
Kristi Cook used to YouTube anonymously. Once she revealed her face, her account became wildly popular.

Creators are crashing through Hollywood, but there’s a ceiling
Hollywood is tapping creators for hit horror films, unique IP, and cameos, but there are limits to their star power in its current state.