Last chance to save on Digiday Publishing Summit passes is February 9
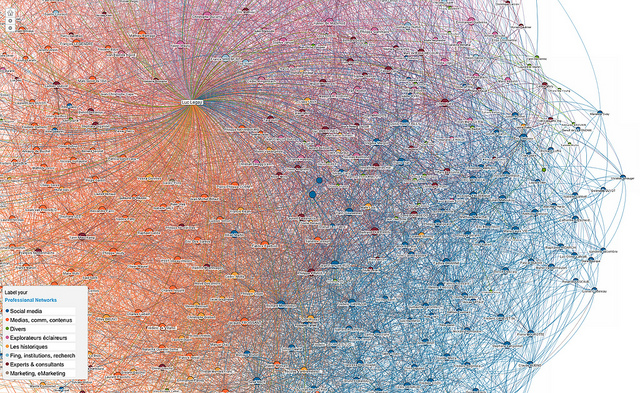
“Infographics” have become ever-present on the Web. But often the term “infographic” gets haphazardly slapped onto things that aren’t much more than a fancy bar chart. (Digiday has definitely been guilty of that in the past.) And now “data visualization” is the new hot label for data graphics. Here is another one of our handy flowcharts to help you answer a tough question: Is it a graph, infographic or data visualization?


More in Media

Brands invest in creators for reach as celebs fill the Big Game spots
The Super Bowl is no longer just about day-of posts or prime-time commercials, but the expanding creator ecosystem surrounding it.

WTF is the IAB’s AI Accountability for Publishers Act (and what happens next)?
The IAB introduced a draft bill to make AI companies pay for scraping publishers’ content. Here’s how it’ll differ from copyright law, and what comes next.
Media Briefing: A solid Q4 gives publishers breathing room as they build revenue beyond search
Q4 gave publishers a win — but as ad dollars return, AI-driven discovery shifts mean growth in 2026 will hinge on relevance, not reach.