Secure your place at the Digiday Media Buying Summit in Nashville, March 2-4

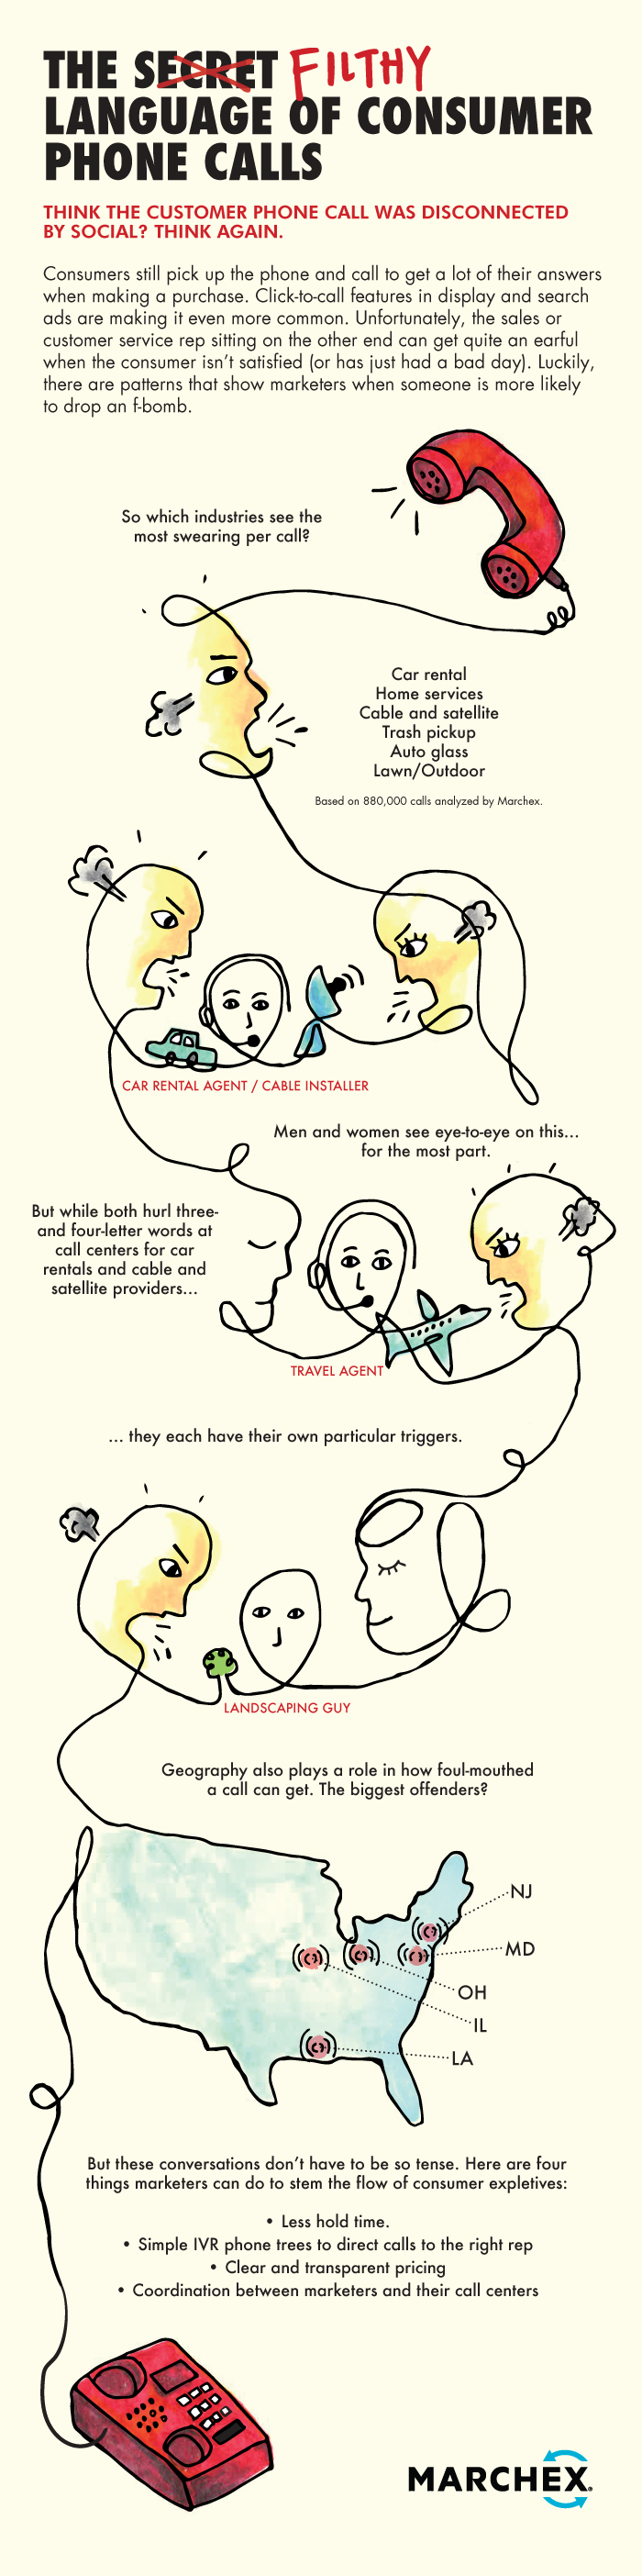
Consumers still pick up the phone and call to get a lot of their answers when making a purchase. Click-to-call features in display and search ads are making it even more common. Unfortunately, the sales or customer service rep sitting on the other end can get quite the earful when the consumer isn’t satisfied. But with unique, digital voice analysis software, marketers are now able to track the number of expletives per call across categories (among many other things, from intent to satisfaction). Check out this infographic to see which industries are most likely to make consumers drop an f-bomb.
Interested in learning more about measuring phone calls from mobile advertising? Download Marchex’s new paper on paid search – The $4 Billion Blind Spot.


More from Digiday

From feeds to streets: How mega influencer Haley Baylee is diversifying beyond platform algorithms
Kalil is partnering with LinkNYC to take her social media content into the real world and the streets of NYC.

‘A brand trip’: How the creator economy showed up at this year’s Super Bowl
Super Bowl 2026 had more on-the-ground brand activations and creator participation than ever, showcasing how it’s become a massive IRL moment for the creator economy.

Future of Marketing Briefing: AI’s branding problem is why marketers keep it off the label
The reputational downside is clearer than the branding upside, which makes discretion the safer strategy.