
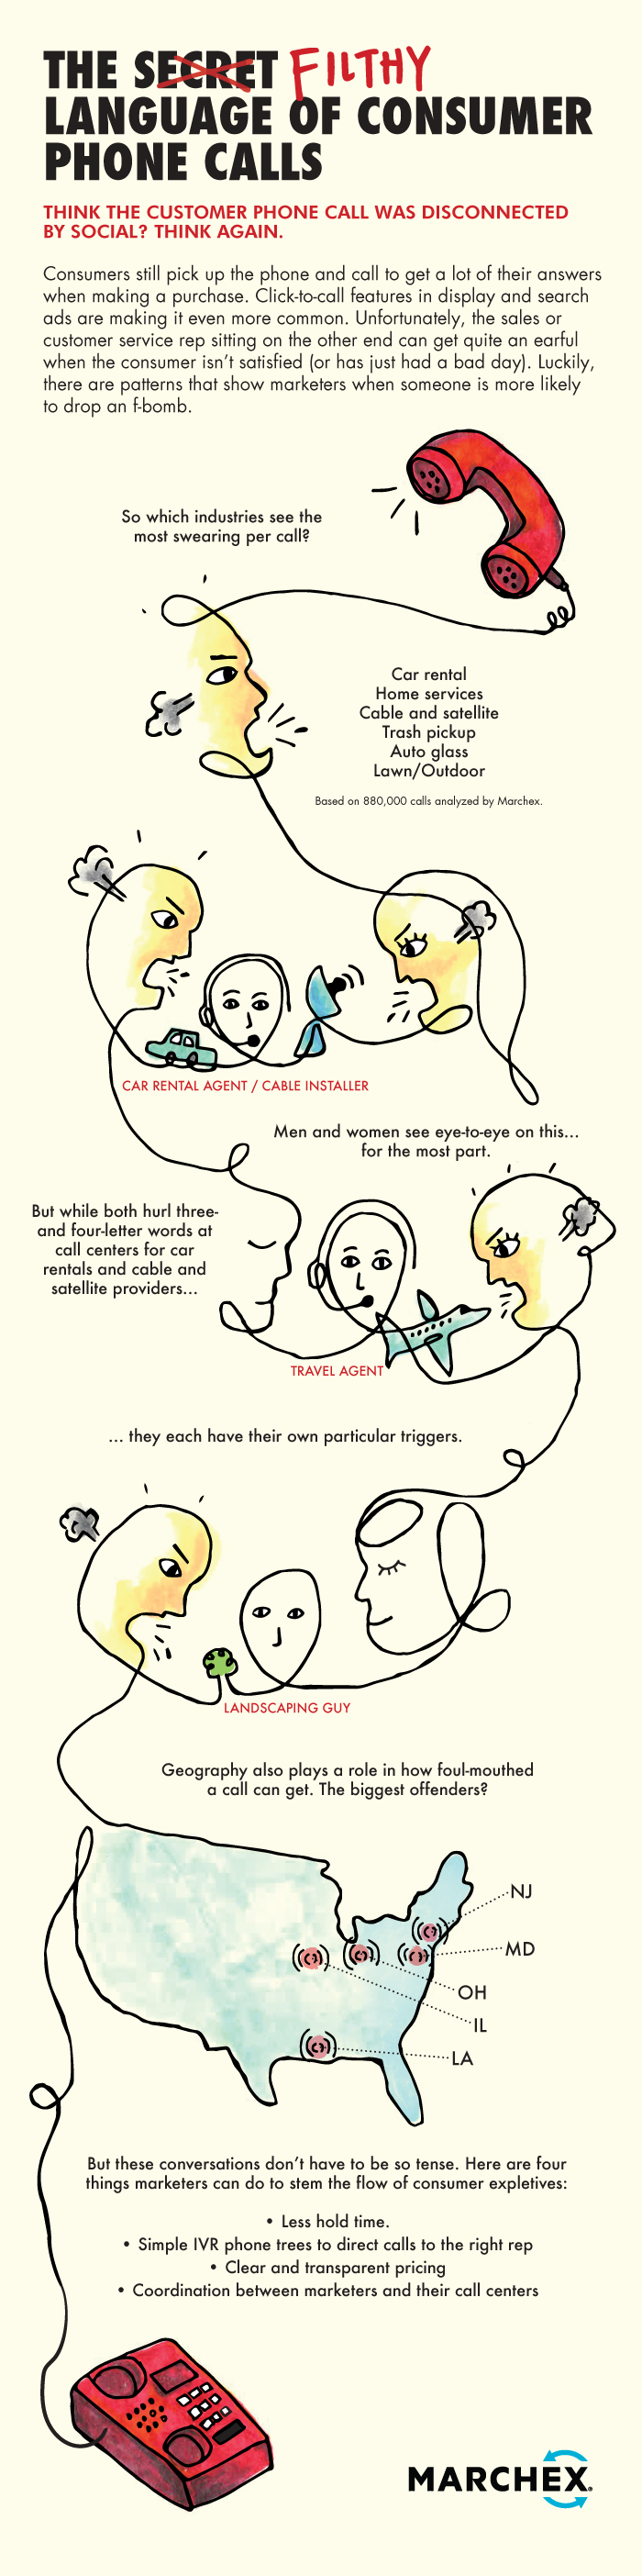
Consumers still pick up the phone and call to get a lot of their answers when making a purchase. Click-to-call features in display and search ads are making it even more common. Unfortunately, the sales or customer service rep sitting on the other end can get quite the earful when the consumer isn’t satisfied. But with unique, digital voice analysis software, marketers are now able to track the number of expletives per call across categories (among many other things, from intent to satisfaction). Check out this infographic to see which industries are most likely to make consumers drop an f-bomb.
Interested in learning more about measuring phone calls from mobile advertising? Download Marchex’s new paper on paid search – The $4 Billion Blind Spot.


More from Digiday

D+ Research: Marketers navigate a changing CTV landscape
As CTV matures, the streaming ad industry is entering a period of change.

Who owns the creative brief? Brands and creators are renegotiating the relationship
Brands are moving creators beyond sponsored posts and into the creative process, reshaping who influences marketing decisions.

Media Buying Briefing: The latest lures holding companies are using to grow principal media
As holdcos rush to equip themselves with AI tools and services, they still haven’t figured out how to sell them. Meantime, principal media has become a major source of profit margin.