Secure your place at the Digiday Media Buying Summit in Nashville, March 2-4

Digital media advertising may still be dogged by issues like fraud, brand safety and dodgy measurement, but that’s not stopping the flow of ad dollars.
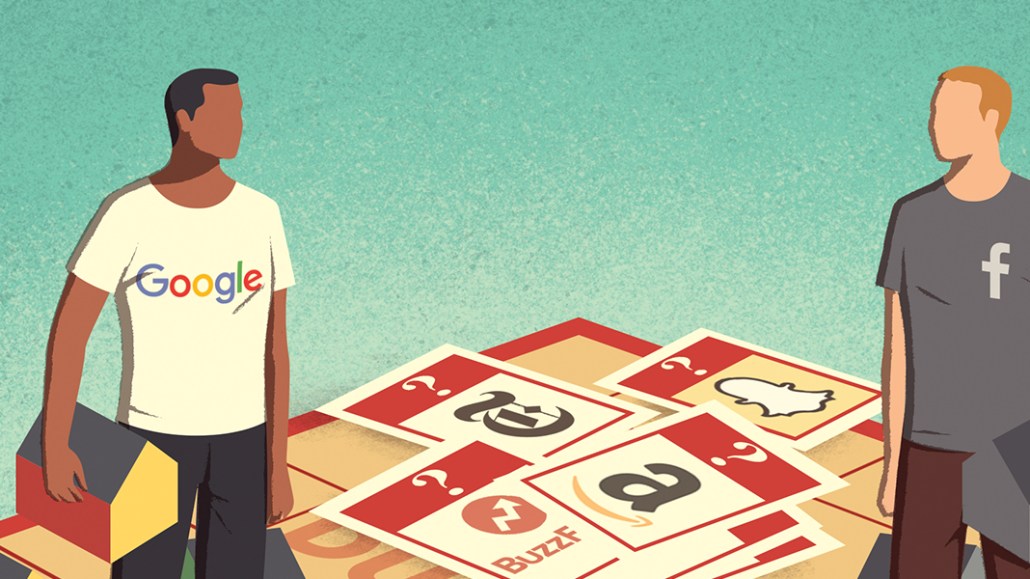
Digital advertising is expected to account for 77 cents of each new ad dollar in 2017, according to GroupM’s “Interaction 2017” report, out this week. Unsurprisingly, Google and Facebook are leading the pack. More than two-thirds of global ad spend growth from 2012 to 2016 came from those two companies.
In 2016, Google and Facebook swallowed 20 percent of the entire global media advertising pie, according to Zenith’s “Top Thirty Global Media Owners” report, also out this week.
And yet, a little sheen may have come off that lately, for Google at least. Confidentially, agency reps say Google has taken more of a hit from the YouTube crisis than it has admitted publicly. “There has been significant fallout from advertisers pulling spend from YouTube,” said one media agency CEO who spoke on condition of anonymity. “There are a lot of advertisers who would normally spend on YouTube who are still not. Google’s numbers are under pressure quarter on quarter.”
Here’s a look at the current state of global advertising spend, in five charts.
Google and Facebook set the pace
Google, under its holding group Alphabet, still leads Facebook, gobbling up $79.4 billion (£61.4 billion) in ad revenue in 2016, three times more than the social network, which took $26.9 billion (£21 billion) last year. In third place was Comcast, which took $12.9 billion (£10 billion) in ad revenue, according to the Zenith report.
Digital-only media owners took a decent chunk of the top 30 slots for biggest media owners by ad revenue. Among them were Verizon, Twitter, Yahoo, Microsoft and Baidu, which together generated $132.8 billion (£103 billion) in online ad revenue in 2016 — 73 percent of all digital ad spend and 24 percent of global ad spend across all media, according to Zenith.
“Zenith’s new ranking demonstrates just how much the internet advertising platforms are setting the pace for global ad spend growth,” said Jonathan Barnard, head of forecasting at Zenith.

Don’t write off Twitter, though
With all the talk of the duopoly dominating spend and Snapchat being the latest digital darling, Twitter has moved somewhat to the sidelines, as evidenced by several reports showing its recent ad revenue drops. But from 2012 to 2016, Zenith showed Twitter grew the fastest, increasing ad revenues by 734 percent. Tencent is second, growing by 697 percent over the same period to $4.3 million (£3.3 million) in 2016, and Facebook is third, with 528 percent growth to $27 million (£21 million), according to Zenith.

Advertising growth is concentrated in big cities
Ten cities will contribute 11 percent of all growth in global ad spend between 2016 and 2019, according to a separate report from Zenith called “Advertising Expenditure Forecasts.” Last year, $61 billion (£47.2 billion) was spent targeting the populations of these cities, and that’s expected to rise to $69 billion (£53.4 billion) by 2019. New York takes the biggest chunk, with $15 billion (£12 billion) expected to be spent on advertising this year. Tokyo isn’t far behind, with $13 billion (£10 billion) expected; London’s spend is expected to be $8 billion (£6.2 billion.)
“People say it’s uncertain times and that budgets are being pulled back, but I don’t buy that,” said Paul Mead, chairman of VCCP Media. “Everyone is trading on a week-by-week, month-by-month basis. They’re not thinking about Brexit and other macro issues. Most of the larger brands know if you turn the tap off from an investment perspective, the revenue is affected.”
TV’s value endures
Digital ad spending has outpaced TV’s in 10 markets to date: Australia, Canada, China, Denmark, Finland, the Netherlands, New Zealand, Norway, Sweden, and the U.K, according to GroupM, which predicts another five markets will cross the line in 2017 (Germany, France, Ireland, Hong Kong and Taiwan.)
And yet, TV is still relatively resilient, holding at 42 percent of ad spend in 2016.
The likelihood of programmatic TV generating real scale remains a distant promise. Likewise, addressable TV, in which data (like home location, purchasing behavior and income) is overlaid to ads that are inserted into linear TV ad slots, also still faces scale challenges.
It’s a mobile world
Digital media’s share of ad spend continues to grow, albeit slowly — it’s projected to reach 33 percent of all media investment in 2017, compared to 30.7 percent in 2016. People are spending more time with media in general — eight hours a day in 2016, according to GroupM. While the average person consumed nine more minutes of media a day in 2016 versus 2015, people spent an extra 14 minutes specifically with online media during the same period because of mobile growth. While platforms like Snapchat aren’t included in the report, they are top of mind.
“Google and Facebook attracted the vast majority of incremental digital ad investment growth in 2016,” said Adam Smith, futures director at Group M. “In 2017, the industry will be watching closely to see how Snapchat or Amazon may creep into Facebook’s and Google’s value chain, and if the stronghold that Baidu, Alibaba, and Tencent has in China can expand to international markets.”

More in Marketing

Future of Marketing Briefing: AI’s branding problem is why marketers keep it off the label
The reputational downside is clearer than the branding upside, which makes discretion the safer strategy.

While holdcos build ‘death stars of content,’ indie creative agencies take alternative routes
Indie agencies and the holding company sector were once bound together. The Super Bowl and WPP’s latest remodeling plans show they’re heading in different directions.

How Boll & Branch leverages AI for operational and creative tasks
Boll & Branch first and foremost uses AI to manage workflows across teams.


