for the Digiday Programmatic Marketing Summit, May 6-8 in Palm Springs.
By now, mobile’s ascent is uncontested. But still unknown is how fast it will continue to climb — and how high it will go.
Start with the usage numbers. Americans spend an average of two hours and 57 minutes a day on mobile devices, a hair more than they do on television, according to app analysis company Flurry. EMarketer expects the global number of smartphone owners to surpass 2 billion by 2016, which represents half of mobile phone owners overall.
With those kinds of penetration and usage numbers, ad spending is also on the rise. Here are the latest projections.
Mobile display revenue will surpass desktop by 2018.
The display ad has seen better days. The rise of ad blocking, coupled with sinking click-through rates and CPMs, has made the display ad format an increasingly tough sell. At the same time, mobile’s prospects are rising as more people around the world get their first smartphones and spend more time glued to their screens. The result is that by 2018, mobile ad spend will overtake that of desktop, according to a recent report from PwC.
Mobile ad share is eating into print, desktop and even television.
While mobile ad spending is on the rise, most of the global spend still goes to television, which controls 39 percent of global ad spend, according to a new report from ZenithOptimedia. Television, however, is showing slight signs of decline. By 2017, its share could dip to 36.8 percent, while mobile’s overall share will climb to 12.9 percent.
Mobile spend is speeding up, while television’s is slowing down.
In terms of growth, mobile is where the action is. Global mobile advertising revenue is expected to climb 52 percent this year, while television ad revenue will increase just 1.2 percent, according to a new report from Magna Global. In absolute terms, though, there’s still a wide gap between the two mediums: Global mobile ad revenue next year will hit $68 billion, while that of television will top $208 billion.
Facebook and Google will keep dominating mobile ad spend.
Still, the mobile revenue opportunity isn’t evenly distributed, and few projections expect that picture to change. This year, Facebook and Google alone will account for half of the $28 billion spent on mobile advertising in the U.S., according to eMarketer. Twitter, the next-largest competitor, will control 4.6 percent, while Yahoo’s share will clock in at 4.1 percent.
Mobile still isn’t getting its fair share.
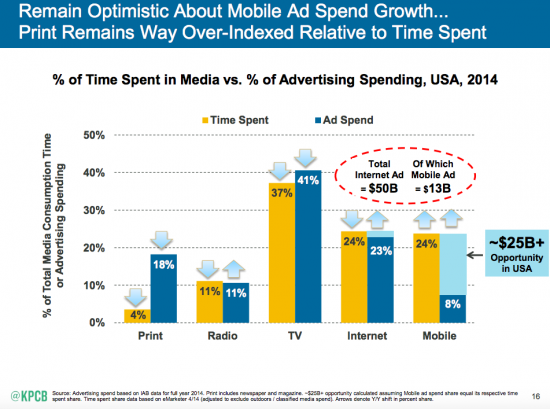
One of the most oft-cited slides in Kleiner Perkins analyst Mary Meeker’s Internet Trends Report is the so-called mobile monetization gap: While Americans spend 24 percent of their time using mobile devices, only 8 percent of ad dollars go to the format. That represents a gap of $25 billion, according to Meeker. Contrast that with newspapers, which command 18 percent of ad spending despite the fact that Americans spend only 4 percent of their time on the format.


More in Media

Vibes over metrics: Why more creators are holding IRL events to own their audience
IRL events are becoming increasingly important pillars of a content creator’s growth strategy; here’s why.

How The Financial Times is betting on personality-led vodcasts as its next subscription lever
By pairing star journalists with a subject‑specific standalone YouTube channel, The Financial Times hopes to deepen parasocial relationships off‑platform and cultivate future subscribers.

From page views to propensity: How the Daily Mail is retooling for a zero-click world
The pressure of zero-click underpins a wider product overhaul: games upgraded from sideshow to front door, new hubs like Crime Desk designed to keep niche communities coming back, an AI-powered dynamic paywall tuned to user behavior; a bigger bet on personalization and the app as a primary destination.