Connect with execs from The New York Times, TIME, Dotdash Meredith and many more
The Financial Times has found an unlikely outlet for its charts and graphics: Instagram.
A year ago, it had 40,000 followers to its Instagram account. Now, it’s at 286,000, and it’s adding thousands by the day, according to the publisher.
“It’s important to make sure we’re not just joining in with what other publications are doing, that we have our distinct voice and identity,” said Jake Grovum, social media journalist at the FT, pointing out that many publishers get their images from the same newswire service. “That’s why we post things that are not necessarily Instagram-friendly, like a chart on how U.S. and U.K. bonds have performed.”
Last week, for instance, it posted two charts and one graphic to the platform. One on Microsoft’s share price reaching an all-time high since since its IPO was the most liked Instagram image of that day with 1,400 likes. It also featured a graphic on how debates have historically affected the U.S. presidential campaign and a chart on the space journey of the Schiaparelli probe. These are a mix of charts taken from the paper, or made specifically for social media, which have a different color-scheme and a black background.
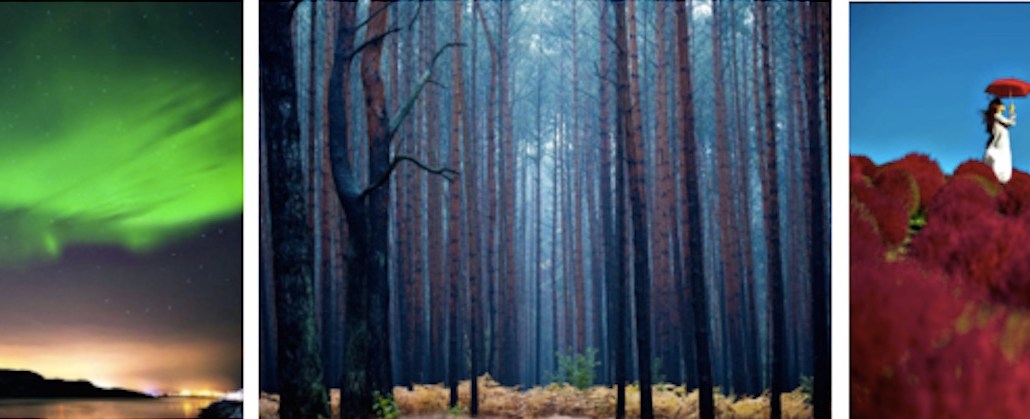
The platform has proven versatile: There’s a place for breaking news, like when Michael Bloomberg announced he was running for president, as well as pieces made specifically for Instagram, like this report on the people around the financial district in London: the deli owners, newsagents, teachers and tailor. Grovum and three social media staffers in London together usually post between one and four images a day. Previously, this was much more intermittent. There’s also room for images that typically would do well on Instagram: Each day, it posts something from the FT photo diary, like this image on the Northern Lights, which had over 2,000 likes.
Instagram is not a traffic play, but the FT regularly updates the bio with links to projects it’s trying to promote. Currently, there’s a link to the Future of Britain, a project on how Britain will look after it leaves the EU. Previously, it has linked to reports on pensions in the U.K. and a poll tracker on the U.S. election.
So far, it’s done 14 Instagram Stories, mostly relying on still images or slides, but it’s growing the use of subtitled video clips too. It’s run Stories on bitcoin, blockchain, discussions on interests rates, previews and then highlights from the presidential debates. These are dense subjects for Instagram but are usually getting a completion rate of 50 percent for Stories that are a dozen clips long, a high completion rate compared to the FT’s other social videos.
“Other social video has a lead image to show what the video is about. On Instagram Stories, you just see the brand’s logo,” said Grovum. “During the Story that previewed the presidential debate, there was a much higher drop-off between the first and second clip. I guess people must have had election fatigue.”
Images: courtesy of the FT, via Instagram.


More in Media

Three publishers’ workforce diversity reports show DEI efforts remain sluggish
Overall, staff diversity at The New York Times, Hearst and Condé Nast has either marginally improved or stalled in 2024, according to their annual workforce diversity data this year.

Retail media meets publishing: News UK, Future and Ocado tap clean room tech for smarter data targeting
News UK, The Independent, Immediate Media and Future are teaming up with retail media network Ocado to test clean room-powered data matching.

From sidelines to spotlight: Esports events are putting creators center stage
Esports events’ embrace of content creators reflects advertisers’ changing priorities across both gaming and the wider culture. In the past, marketers viewed esports as one of the best ways to reach gamers. In 2025, brands are instead prioritizing creators in their outreach to audiences across demographics and interest areas, including gaming.