The Internet is now visual — just witness the rise of Instagram, Pinterest, Snapchat and others.
To get a sense of the sheer amount of data being uploaded to the Web, look no further than every Second on the Internet, a site that visualizes our love of uploading stuff. Blink, and you’ll miss the fantastical upload rates for each platform. Increasingly, we share visuals like photos, videos and memes. Tumblr alone boasts 113 million posts a day. An even more staggering fact is that users upload 100 hours of video to YouTube every minute. If it’s true that Moore’s Law just got an extension, the world can comfortably settle in to an Internet that remains visual. Here’s the numbers.
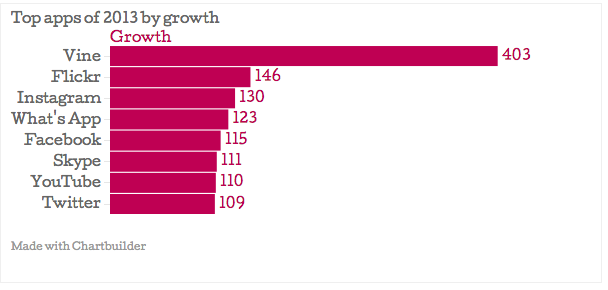
If you haven’t heard, mobile app usage is on the rise, pushing hard against the mobile Web stalwarts everywhere. In 2013, the top 8 apps were all either strictly visual or included visual capabilities (i.e., WhatsApp). Newer additions like Snapchat and Secret are rethinking how images play into our daily conversations, indicating we can expect new ways to communicate in the future.
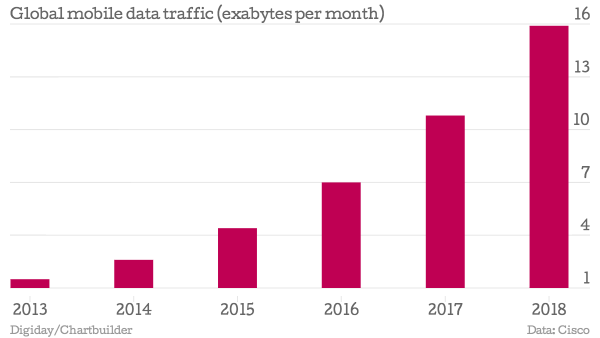
Data compiled by Cisco indicates that, as we’ve previously reported, mobile usage will grow 11 times to 15 exabytes per month by 2018. Cross that data with the growth of visual apps, and a compelling case can be made for the likelihood that images, video and the like will permeate human culture for the foreseeable future.
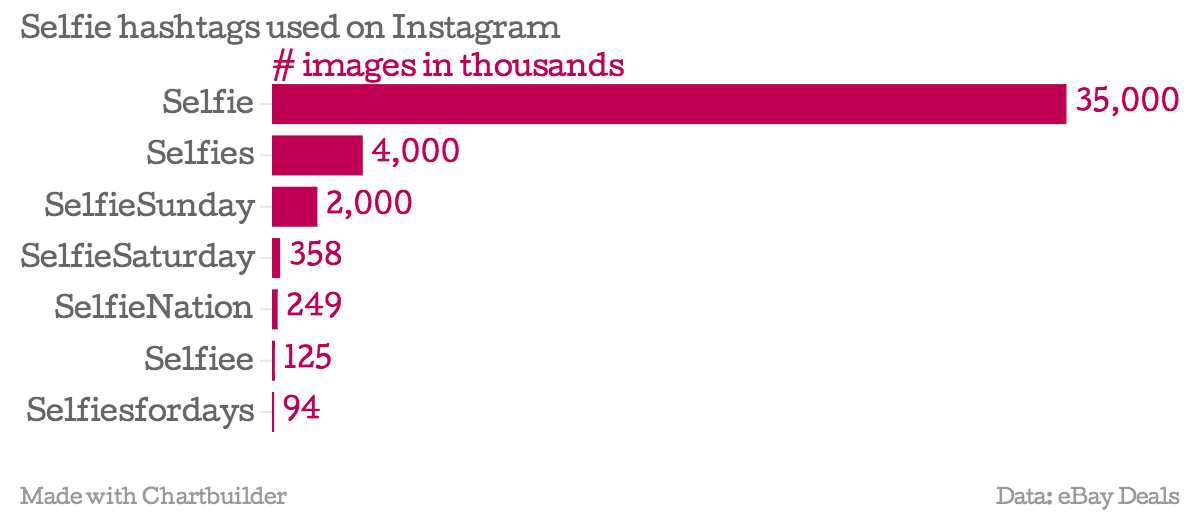
Ah yes, selfies, the defining image trend of our time. Subtrends like selfies include planking, coning, vadering and so much more. They crop up now and then, taking over social feeds like locusts. This Google trends query shows that use of the word selfie has grown exponentially since 2012. Sure, selfies existed before then, but the culture of naming image trends was in its infancy before then. That may seem insignificant until you remember that we’re talking about the existence of the visual Web. Like them or not, selfies and other image trends are proof that a cultural system is in place.
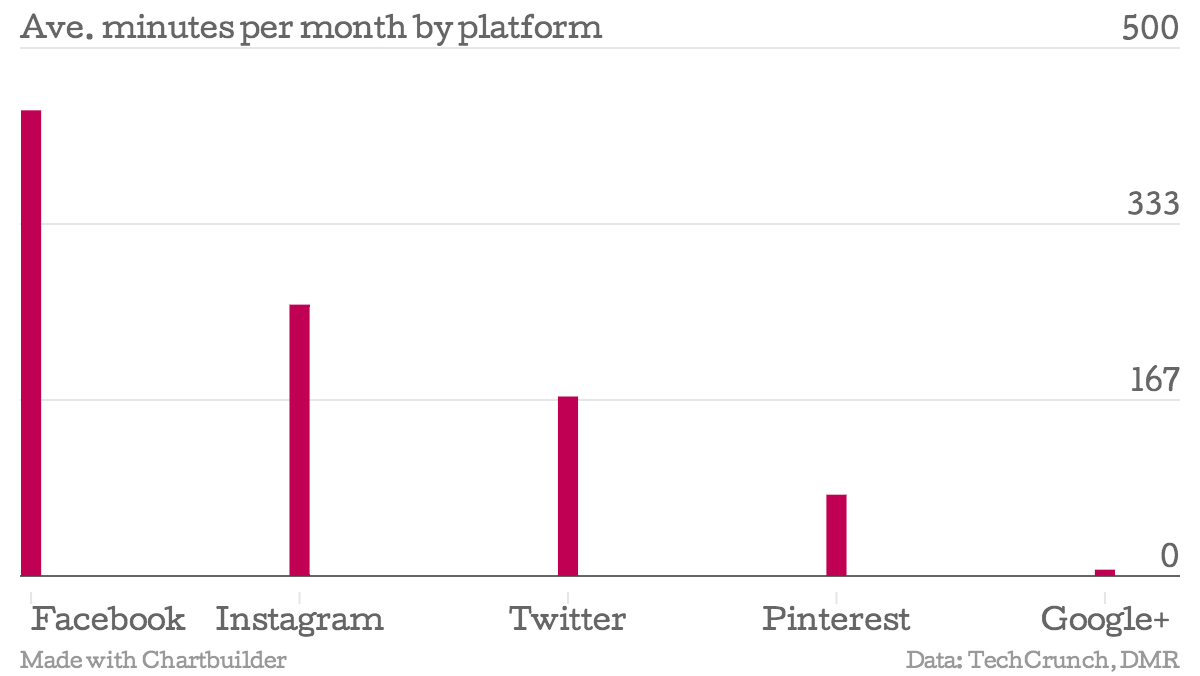
We wanted to show you a chart depicting that time spent on the major platforms has increased over the last few years, but the data doesn’t seem to exist. That said, look at these averages. People spend 441 minutes spent on Facebook on average per month. That’s an eight-hour work day (with a 30-minute break to do actual work). What are people doing in all that time? Looking at images and videos, commenting on charts, liking memes. If that doesn’t convince you, Instagram’s 257 minute average should since it’s a purely visual tool.
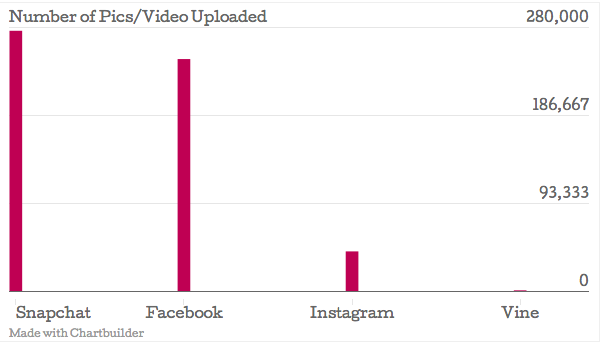
Last, we looked at the number of photos and videos being uploaded every minute. Certainly, one needn’t upload an image or video to share it; all you need to do is find something you like online and share it. But in terms of new content, the numbers are staggering just the same. Snapchat boasts 276,000 snaps per minute. If that was miles per second, Snapchat would be faster than the speed of light (186,000 mps). Facebook comes in just behind with an average of 246,000 images and videos per second, which is roughly the population of Plano, Texas. And in case you think it’s sad that Vine only has 700 uploads per minute, remember there are 1,440 minutes in a day.


More in Media

Kroger’s new CEO, a Walmart veteran, is focused on speed and execution
Foran joined Kroger in February after serving as CEO of Air New Zealand since 2020. Before that, he was president and CEO of Walmart U.S. for about six years.

In Graphic Detail: The real impact of creators at the World Cup
The 2026 World Cup buzz was all about creators; we look at the numbers breaking down their impact at the global tournament.

Media Briefing: Brand authority and trust are becoming publishers’ newest AI assets
Some publishers are betting that trusted brands and editorial authority are becoming their biggest competitive advantage with LLMs.